Redundancy in the Topology of Weighted Graphs
Distance Backbones
Network science has provided many insights into the organization of complex systems. The success of this approach is its ability to capture the organization of multivariate interactions as networks or graphs without explicit dynamical rules for node variables. As the field matures, however, there is a need to move from understanding to controlling complex systems. This is particularly true in systems biology and medicine, where increasingly accurate models of biochemical regulation have been produced, or in social networks to study epidemic spread for pandemic management. We have contributed to this goal with two mathematical concepts which allow us to remove different forms of redundancy in networks: 1) distance closures, and 2) canalization via schema re-description. The first concept allows us to infer the invariant subgraph that is sufficient to compute all shortest paths in a weighted graph: the distance backbone. This has demonstrated that there is massive redundancy in many networks in different domains, whereby most edges in a network are not necessary to compute shortest paths (e.g. 90% of edges in some brain networks). Removing redundant edges can facilitate computation and discovery of important pathways in many applications. The removal of this redundancy simplifies and indeed enables the characterization of information transmission and dynamics on large biochemical, brain, social, technological, and knowledge (including for automatic fact-checking) networks, which are otherwise too large to study analytically [Correia et al, 2022; Correia, Barrat, and Rocha, 2022; Simas, Correia, and Rocha, 2022; Teixeira et al, 2020; Simas and Rocha, 2015; Ciampaglia et al, 2015; Simas and Rocha, 2012; Rocha, 2002] .
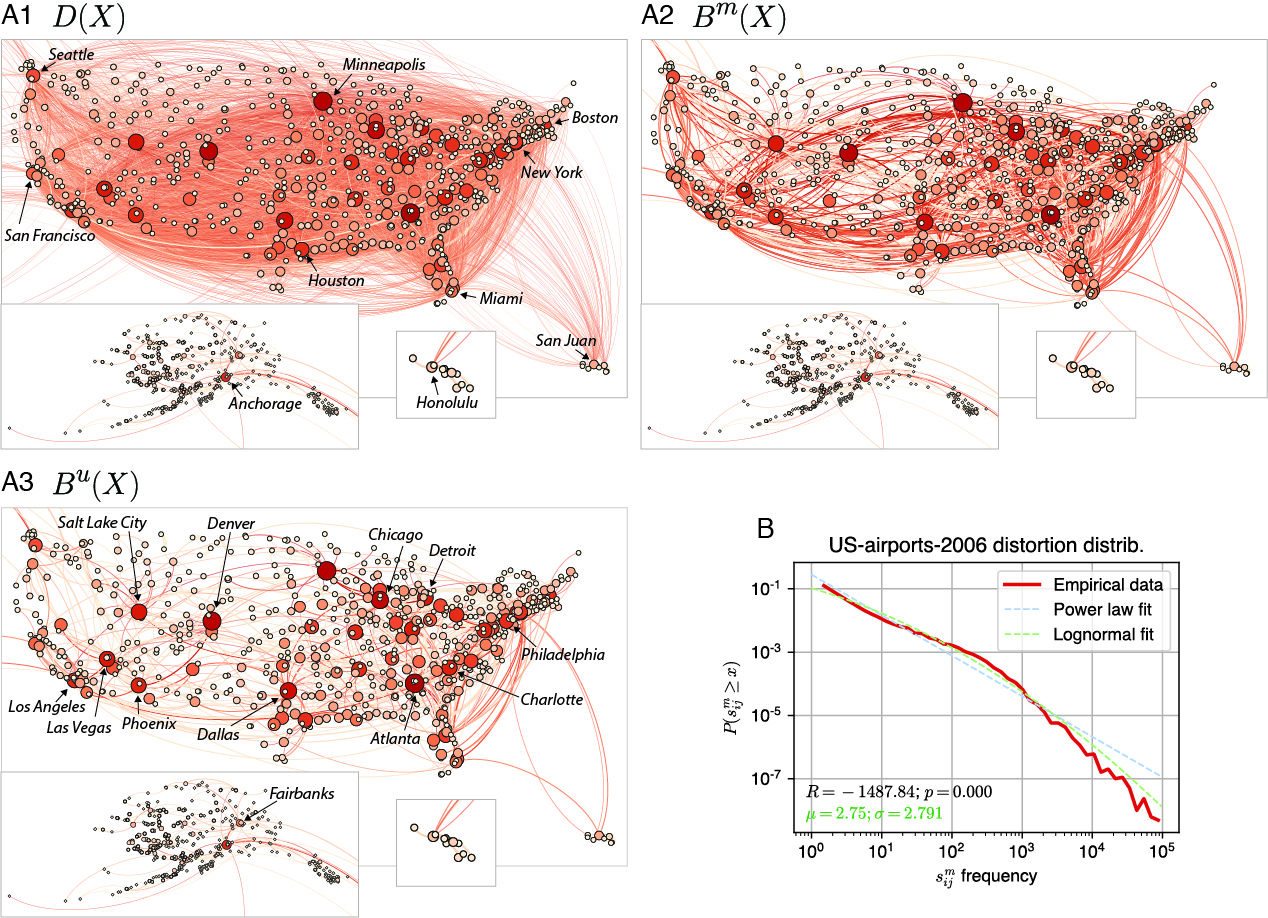
The U.S. domestic nonstop airport transportation network and backbones for the year 2006. A1. Distance network with weights representing the average number of passengers between two airports. This is a reconstruction of the network used in Serrano et al. [55] that keeps only the largest connected component and removes some U.S territory airports (e.g. Guam). A2. Metric backbone with only 16% of the original edges. A3. Ultrametric backbone with only 9% of the original edges. B. Log-binned distribution of semi-metric distortion values for the 84% of semi-metric edges in the network. From Simas, Correia, and Rocha [2022]

Proximity network of drug-drug interactions (DDI network) extracted from a electronic health records of a large population. Nodes denote drugs involved in at least one co-administration known to be a DDI. Node color represents the highest level of primary action class, as retrieved from Drugs.com (see legend). Node size represents the probability of interaction. Edge weights denote risk in population. Edge colors denote edges that are higher risk for females (blue) or males (red). From Correia et al [2019]
Weighted and Proximity Graphs
The prime example of a Document Network (DN) is the World Wide Web (WWW). But many other types of such networks exist: Wikipedia, electronic health records, bibliographic databases containing scientific publications, social media platforms, as well as databases of datasets used in scientific endeavors. Each of these databases possesses several distinct relationships among documents and between documents and semantic tags or indices that classify documents appropriately. For instance, documents in the WWW are related via a hyperlink network, while documents in bibliographic databases are related by citation and collaboration networks. Furthermore, documents can be related to semantic tags such as keywords used to describe their content. Given these relations, we can compute distance functions (typically via co-occurrence measures) amongst documents and/or semantic tags, thus creating associative, weighted networks between these items—which denote stronger or weaker co-associations. We have used such distance and proximity networks for inference and discovery of protein-protein and drug-drug interactions, health and comorbidity risks, gender and age biases, automatic fact-checking, pharmacokinetic parameters in drug interaction and adverse reaction studies, protein sequence and structure prediction, functional annotation of transcription data, enzyme annotation publications, etc (see publications listed below). We have also used distance and proximity graphs to uncover modules or clusters in the network that may be associated with a particular topic or community of interest. We have applied clustering methods to biomedical, social, knowledge, scientific co-authorship and citation networks (see our bibliome informatics and adaptive web projects for more details),etc. We have also used information-theoretical approaches to classify documents of interest in probabilistic graphs of citation co-occurrence in scientific citation networks [Kolchinsky et al, 2010].
Semi-metric networks
We study the non-metric network topologies that arise in weighted graphs obtained from real-world data (e.g. co-occurrence statistics). In particular, we have developed measures to extract the graph edges which most violate the triangle inequality: semi-metric associations (which are removed to reveal distance backbones above). Our working hypothesis is that strong semi-metric associations can be used to identify trends, items with a higher probability of co-occurring in the future, as well the dynamics of such networks in general. This methodology has been successfully applied to networks of biochemical and biomedical entities, published documents, recommender systems for digital libraries at the Los Alamos National Laboratory, web search and recommendation by the givealink.org project, networks of felons obtained from intelligence records, and gene networks (see publications below). This work has been pursued in the Identification of Interests, Trends and Dynamics in Document Networks Project as well as in a Los Alamos Homeland Security LDRD DR project, “Advanced Knowledge Integration (LDRD Reserve)” to discover latent associations in social networks (internal report available). Some of this work was also funded by NSF grant from the Human and Social Dynamics program, With Eliot Smith and Rob Goldstone—which received some attention in the media for being one of the first to look at facebook data.

An associative network of people names extracted from co-occurrence in documents in a database as described in an internal report. You can also see a 3D Video (Real Video) of this network.
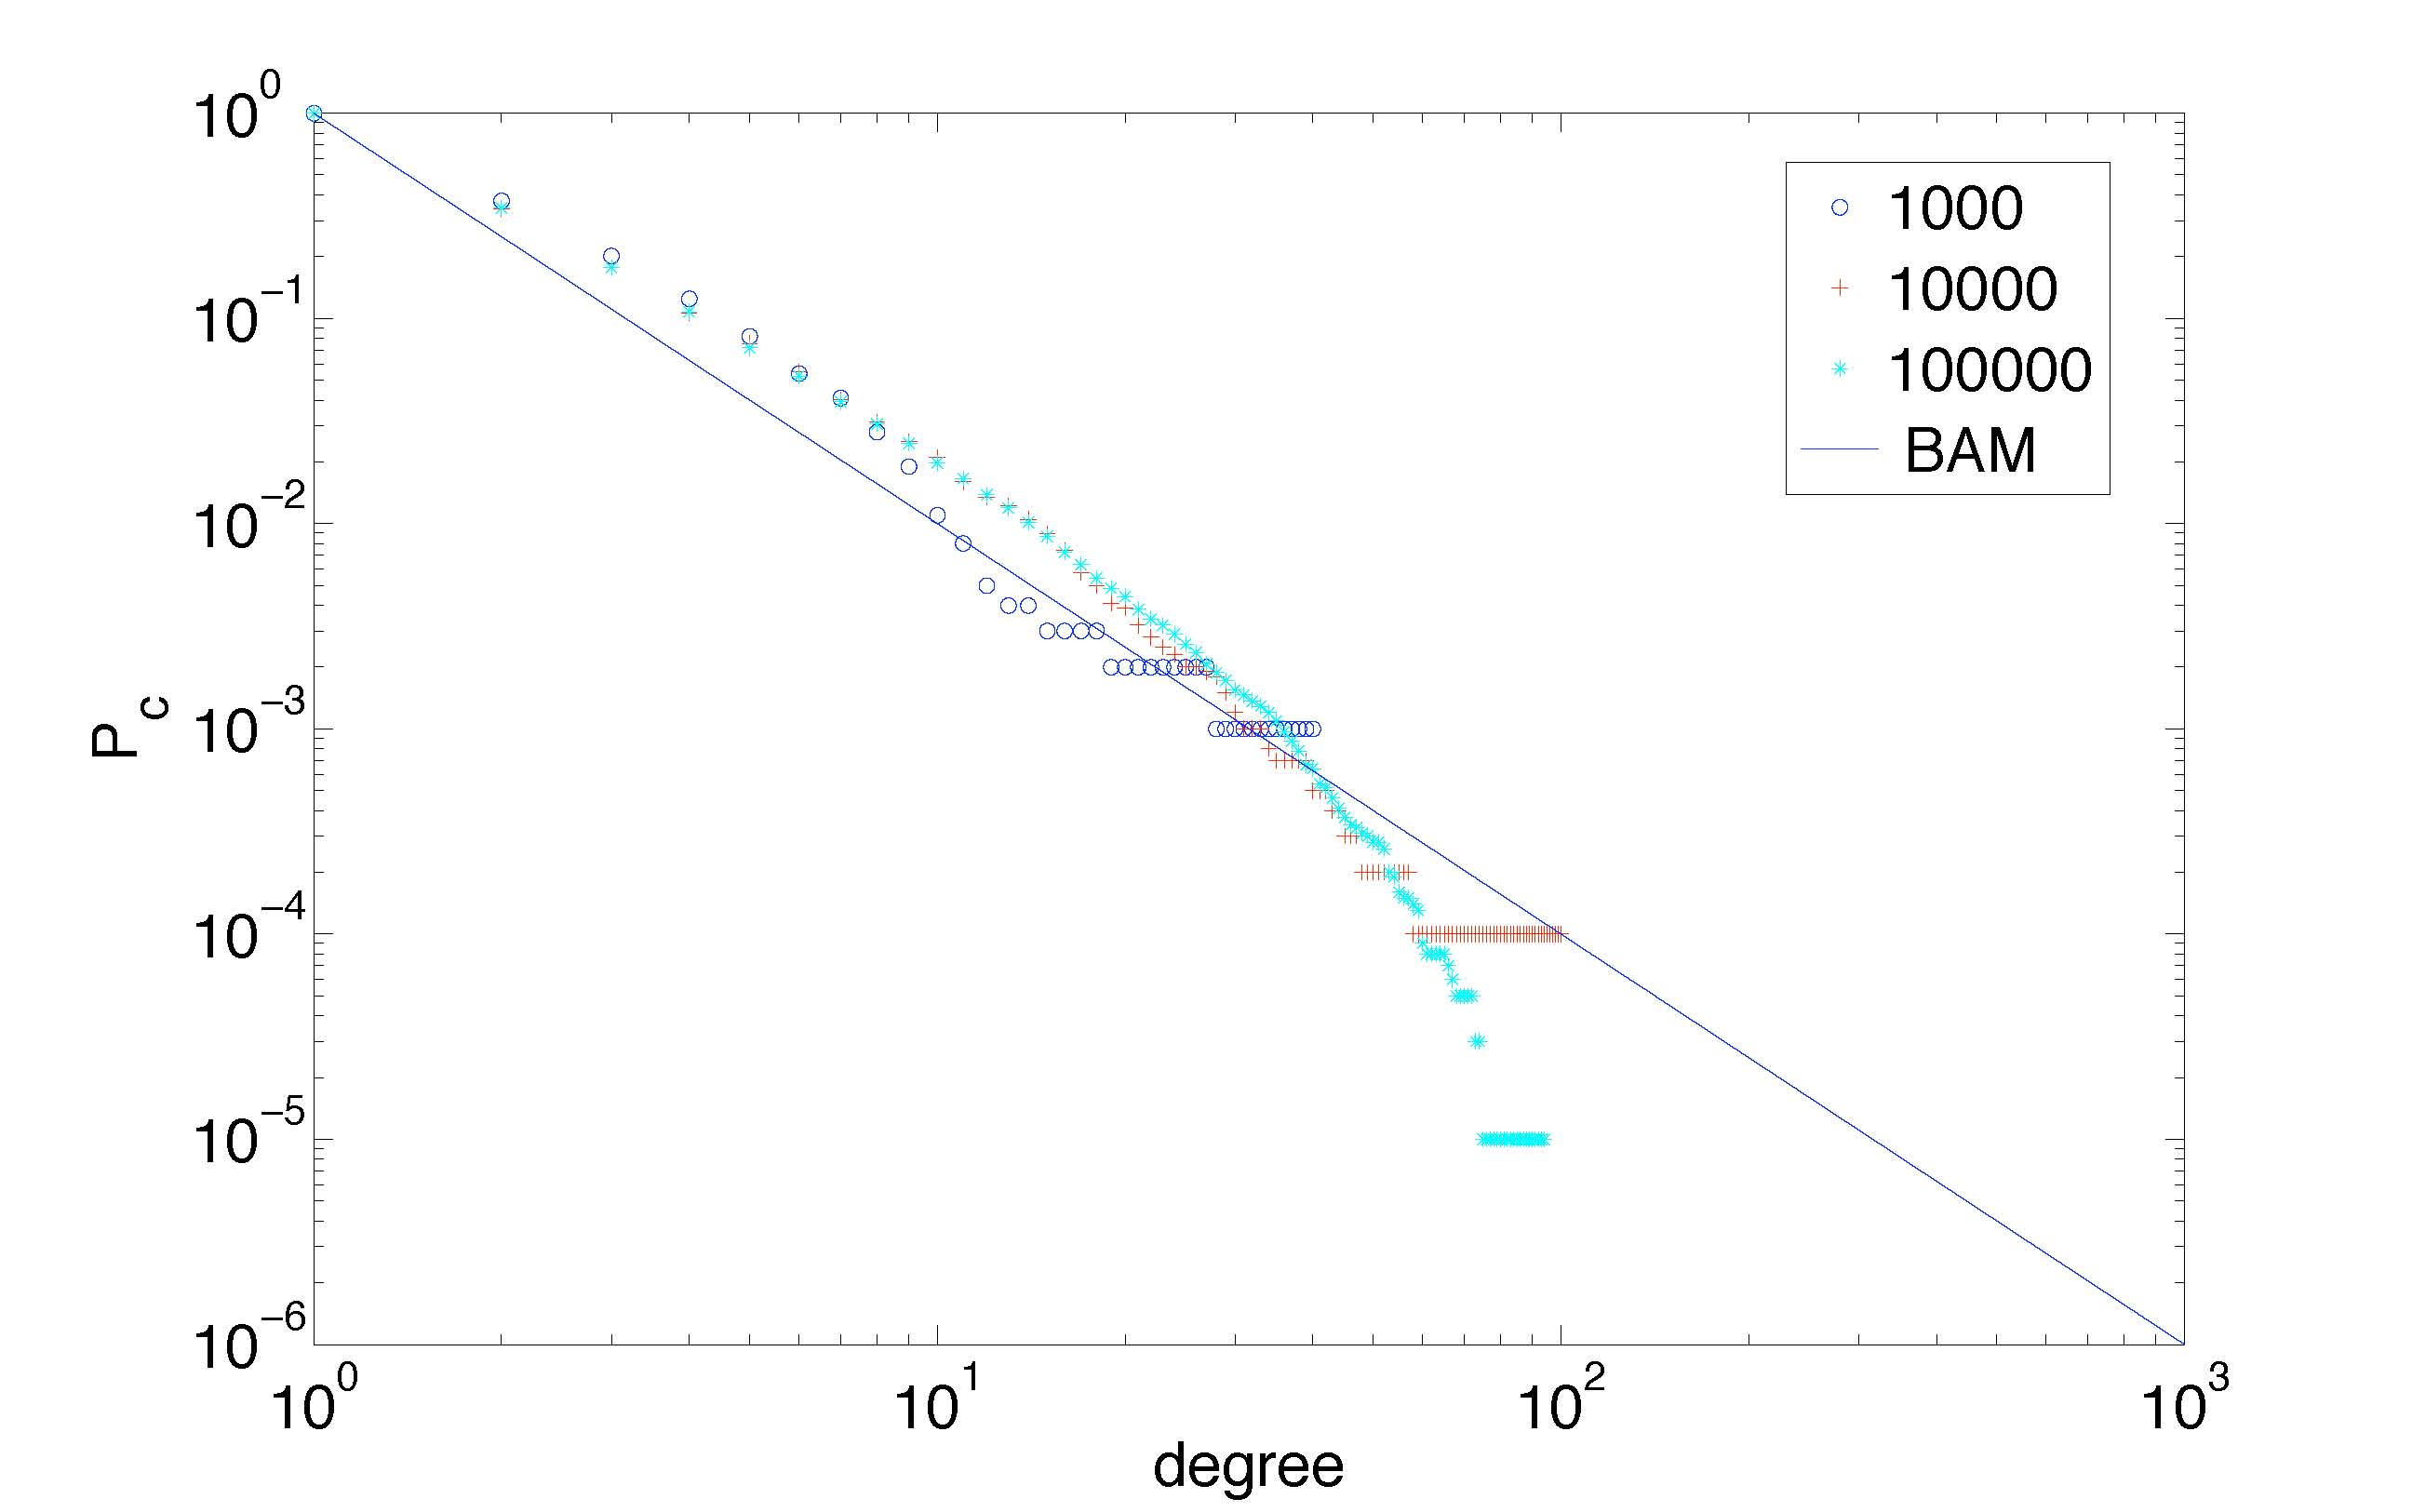
Cumulative degree distribution for network sizes as predicted by stochastic model of (Simas and Rocha, 2008)
Stochastic model of cut-off behavior
We have developed a stochastic model of vertex aging in networks, to better predict network growth [Simas and Rocha, 2008]. Real world networks display a cut-off in the power-law node degree distributions of complex networks, not expected by the canonical Barabasi-Albert Model. Amaral et al had shown that this cut-off behavior can be computationally modeled with vertex aging. We produced a mathematical model of vertex aging, which allows accurate predictions of the equilibrium point of active vertices and relate network growth with probability of aging.
Funding Project partially funded by
- myAURA: Personalized Web Service for Epilepsy Management. National Institutes of Health, National Library of Medicine Program, 1R01LM012832-01, October 2018-2023
- National Science Foundation, Research Traineeship Program, NSF1735095: Interdisciplinary Training in Complex Networks and Systems, 2017-2022
- Fulbright U.S. Scholar grant, J. William Fulbright Foreign Scholarship Board (FFSB). 2016-2017
- Persistent Systems, Ltd., "Large-Scale Text and Social Data Analytics for Health", 2014-2017
- Recommendation systems for CareerBuilder.com Project, 2013.
- IARPA Contract: Early Model-Based Event Recognition with Surrogates (EMBERS), 2012-2014.
- National Science Foundation, Human and Social Dynamics Program”, 2005-2008. Project title: “DHB: Dynamics of Information Flow and Decisions in Social Networks”, with Eliot Smith, Robert Goldstone, Hugh Kelly.
Project Members (Current and Former)

Luis M. Rocha (PI)

Alaa Abi-Haidar

Alain Barrat

Katy Börner

Paulo Navarro Costa

Rion Brattig Correia

Felipe Xavier Costa

Ziqi Guo

Artemy Kolchinsky

Ana Maguitman

Jordan C. Rozum

Tiago Simas

David Soriano-Paños

Olaf Sporns

Andreia Sofia Teixeira
Selected Project Publications
- R.B. Correia, J.C. Rozum, L. Cross, J.Felag, M. Gallant, Z. Guo, B.W. Herr II, A. Min, J. Sanchez-Valle, D.S. Rocha, A. Valencia, X. Wang, and K.Börner, W.R.Miller, and L.M. Rocha. [2025]. "myAURA: Personalized health library for epilepsy management via knowledge graph sparsification and visualization". Journal of the American Medical Informatics Association, ocaf012. DOI: 10.1093/jamia/ocaf012. Preprint also available: arXiv:2405.05229.
- J. Sánchez-Valle, M. Flores-Rodero, F.X. Costa, J. Carbonell-Caballero, I. Núñez-Carpintero, R. Tabarés-Seisdedos, L.M. Rocha, D. Cirillo, A. Valencia [2025]. "Sex-specific transcriptome similarity networks elucidate comorbidity relationships." bioArXiv Preprint. DOI: 10.1101/2025.01.22.634077. Preprint also available: arXiv:2405.09649.
- M. De Domenico, L. Allegri, G. Caldarelli, V. d'Andrea, B. Di Camillo, L.M. Rocha, J. Rozum, R. Sbarbati, F. Zambelli [2025]. "Challenges and opportunities for digital twins in precision medicine: a complex systems perspective." npj Digital Medicine 8, 37. DOI: 10.1038/s41746-024-01402-3. Preprint also available: arXiv:2405.09649.
- Z. Guo, J. Felag, J.C. Rozum, R.B. Correia, and L.M. Rocha. [2024]. "Selecting focused digital cohorts from social media using the metric backbone of biomedical knowledge graphs.". arXiv:2405.07072. DOI: 10.48550/arXiv.2405.07072.
- R.B. Correia, J.M. Almeida, Ma.J. Wyrwoll, I.Julca, D. Sobral, C.S. Misra, L.G. Guilgur, H.-C. Schuppe, N. Silva, P. Prudêncio, A. Nóvoa, A. S. Leocádio, J. Bom, M. Mallo, S. Kliesch, M. Mutwil, L.M. Rocha, F.Tüttelmann, J. D. Becker, P. Navarro-Costa [2024]. "The conserved genetic program of male germ cells uncovers ancient regulators of human spermatogenesis". eLife 13: RP95774. doi: 10.7554/eLife.95774.3.
- J.C. Rozum, and L.M. Rocha.[2024]. "The ultrametric backbone is the union of all minimum spanning forests". Journal of Physics: Complexity. ad679e. DOI: 10.1088/2632-072X/ad679e. Also available: arXiv: 2403.12705.
- Paños, David Soriano, Felipe Xavier Costa, and Luis M. Rocha. [2023]. "Semi-metric topology characterizes epidemic spreading on complex networks". arXiv:2311.14817. DOI: 10.48550/arXiv.2311.14817
- R.B. Correia, A. Barrat, L. M. Rocha [2023]. "Contact networks have small metric backbones that maintain community structure and are primary transmission subgraphs". PLoS Computational Biology. 19(2): e1010854. doi: 10.1371/journal.pcbi.1010854.
- V. Dorsant-Ardon, A. B. Sanjay, L.M. Rocha, R.B. Correia, and L.G. Apostolova. [2023]. "Gene co-expression network analyses in mild cognitive impairment" Alzheimer's & Dementia. 19: e082238. DOI: 10.1002/alz.082238
- F.X. Costa, R. B. Correia, L.M. Rocha [2023]. "The distance backbone of directed networks". In: Cherifi, H., Mantegna, R.N., Rocha, L.M., Cherifi, C., Micciche, S. (eds) Complex Networks and Their Applications XI. COMPLEX NETWORKS 2022. Studies in Computational Intelligence, vol 1078. Springer, Cham. Preprint also available:arXiv:2209.01181.
- Simas, T., R.B Correia and L.M. Rocha [2021]. "The distance backbone of complex networks". Journal of Complex Networks. 9 (6), cnab021. DOI: 10.1093/comnet/cnab021. Preprint at: arXiv:2103.04668
- Sanjay, A. B., Correia, R. B., Rocha, L. M., and Apostolova, L. G. [2021]. "Transcriptomic profiling in mild cognitive impairment using peripheral blood gene co‐expression networks". Alzheimer's & Dementia, 17, e056702. DOI: 10.1002/alz.056702.
- Teixeira, A. S., J. Faskowitz, O. Sporns, and L.M. Rocha [2020]. "The Metric Backbone in the Human Connectome and across Lifespan". Complex Networks 2020. The 9th International Workshop on Complex Networks and Their Applications. Dec. 1-3, 2020, Madrid, Spain (Online).
- R.B. Correia, L.P. de Araújo, M.M. Mattos, L.M. Rocha [2019]. City-wide Analysis of Electronic Health Records Reveals Gender and Age Biases in the Administration of Known Drug-Drug Interactions. NPJ Digital Medicine. 2:74.
- R.B. Correia, N. Ratkiewicz, A. Barrat, L.M. Rocha [2018]. The Metric Backbone of Contact Networks in Epidemic Spread Models. Paper and Materials presented at NetSci 2018: International School and Conference on Network Science.
- G.L. Ciampaglia, P. Shiralkar, L.M. Rocha, J. Bollen, F. Menczer, A. Flammini [2015]. “Computational fact checking from knowledge networks.” PLoS One. 10(6): e0128193. doi:10.1371/journal.pone.0128193.
- T. Simas and L.M. Rocha [2015]."Distance Closures on Complex Networks". Network Science, 3(2):227-268. doi:10.1017/nws.2015.11
- T. Simas and L.M. Rocha [2012].”Semi-metric networks for recommender systems“. 2012 IEEE/WIC/ACM International Conferences on Web Intelligence and Intelligent Agent Technology, pp. 175-179.
- T. Simas [2012] “Stochastic Models And Transitivity In Complex Networks”. Ph.D. Dissertation, Cognitive Science, Indiana University.
- A. Kolchinsky, A. Abi-Haidar, J. Kaur, A.A. Hamed and L.M. Rocha [2010]. “Classification of protein-protein interaction full-text documents using text and citation network features.” IEEE/ACM Transactions On Computational Biology And Bioinformatics, 7(3):400-411. DOI: doi.ieeecomputersociety.org/10.1109/TCBB.2010.55
- T. Simas and L.M. Rocha [2008].”Stochastic model for scale-free networks with cutoffs“. Physical Review E, 78(6):066116.
- A. Abi-Haidar, J. Kaur, A. Maguitman, P. Radivojac, A. Retchsteiner, K. Verspoor, Z. Wang, and L.M. Rocha [2008]. Uncovering protein interaction in abstracts and text using a novel linear model and word proximity networks“. Genome Biology. 9(Suppl 2):S11
- The semi-metric methodology has also been used by the givealink.org project. L. Stoilova, T. Holloway, B. Markines, A. Maguitman, F. Menczer [2006]: “GiveALink: Mining a Semantic Network of Bookmarks for Web Search and Recommendation“. Proc. KDD Workshop on Link Discovery: Issues, Approaches and Applications.
- Rocha, L.M., T. Simas, A. Rechtsteiner, M. DiGiacomo, R. Luce [2005]. “MyLibrary@LANL: Proximity and Semi-metric Networks for a Collaborative and Recommender Web Service“. In: Proc. 2005 IEEE/WIC/ACM International Conference on Web Intelligence (WI’05), IEEE Press. IEEE Press, pp. 565-571.
- Verspoor, K., J. Cohn, C. Joslyn, S. Mniszewski, A. Rechtsteiner, L.M. Rocha, T. Simas [2005]. “Protein Annotation as Term Categorization in the Gene Ontology using Word Proximity Networks“. BMC Bioinformatics, 6(Suppl 1):S20. doi:10.1186/1471-2105-6-S1-S20
- Rocha, Luis M. [2002]. “Semi-metric Behavior in Document Networks and its Application to Recommendation Systems”. In: Soft Computing Agents: A New Perspective for Dynamic Information Systems. V. Loia (Ed.) International Series Frontiers in Artificial Intelligence and Applications. IOS Press, pp. 137-163.
- Rocha, Luis M. [2002]. “Combination of Evidence in Recommendation Systems Characterized by Distance Functions”. In: Proceedings of the 2002 World Congress on Computational Intelligence: FUZZ-IEEE’02. Honolulu, Hawaii, May 2002. IEEE Press, pp. 203-208. LAUR 02-154.