
For more information contact Luis Rocha at rocha@lanl.gov
Last Modified: June 23, 1999
These remarks follow conversations between Joslyn, Rocha, and Dr. Eric Minch (Senior Manager for Bioinformatics, LION Bioscience AG, Heidelberg) in May, 1999, at the Closure 99 Conference in Ghent, Belgium. This document is intended to provide a (hopefully accurate) description of Minch'es problem, followed by a brief description of a potential GSPS approach, with an emphasis on Mask Analysis. The goal is to explore the potential for collaboration between LION and CIC-3.
Minch has experimental data of the following form. At a discrete time t, the "intensity" of expression of n genes (from 1000 to 40,000) is measured. This quantity is bounded and continuous, and thus mapped to a value xit in the unit interval [0,1],1 <= i <= n. These expression intensities are measured for m consecutive time steps (for now a small number of steps) , so that 1 <= t <= m. Any number N of such runs of 10 can be generated. Despite the fact that some runs can be generated from the same cell cycle, they should all be considered independent trials k. The goal is to hypothesize causal time relations among the genes, for example, if gene 150 is "on" at time t, and gene 160 is "off" at time t-1, then (with high likelihood) genes 200 and 220 will be "on" at time t+1.
GSPS is an inductive modeling methodology developed by George Klir in the 1980's [Klir 1985]. It is a "general systems" approach in that all databases are represented as fuzzy relations, perhaps probabilistic, possibilistic, or neither. General information theoretical measures are then used to measure various forms of structure among variables.
"Supports" (independent variables) are distinguished from "variables" (dependent variables). The dimensionality of the fuzzy relation is then the number of supports. Both supports and variables are typed according to cardinality (finite, countable, uncountable), any orderings (partial or total), and boundedness.
In our case, the data map either to:
There are two primary methods in GSPS:
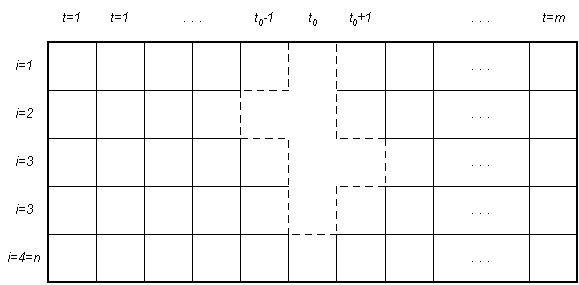
On the surface, Mask Analysis appears to be the most appropriate GSPS method here. A mask is a particular collection of variables measured over a particular combination of relative time steps. Each mask represents an hypothesis about support- (time) dependences among collections of variables. For a given data set, the space of all masks no bigger than a certain size is searched for two alternate orders (simplicity and prediction accuracy), and the candidate set of optimal masks determined.

Mask analysis is illustrated above for n = 4. Assume an arbitrary time t0. Then the mask considered above consists of { x01 , x-12 , x02, x03, x13, x04, }. These times are relative, and the mask is understood to "slide" across the data set. meaning that the values of variables 1, 2, and 3 at time 0 and 3 at time 1 is "determined" by the values of variables 2 and time -1 and 3 at time 0, as expressed by conditional entropies or nonspecificities.
This mask has "depth" three. Mask analysis proceeds to consider all possible masks, and balancing a high degree of accuracy of determination against a low mask depth.